Two people leave Hattiesburg for Nashville at the same time. Both arrive at the same time. If all you saw was the arrival time, you would imagine they probably had the same trip.
The first driver set the cruise control and held a steady speed the whole way. No stops, no aggressive driving, not a ton of risk. The second driver spent the trip alternating between 95 miles per hour and 35, sometimes because of traffic, sometimes because of a heavy foot. When all was said and done, they had the same average speed and same arrival time, but riders in both cars experienced very different trips.
Investing has the same problems. The number most people look at, the average return, is the arrival time. It tells you where the portfolio ended up. It tells you almost nothing about what the trip there looked like.
Here is a hypothetical example. Imagine two portfolios that each start with $100,000 and are held for five years.
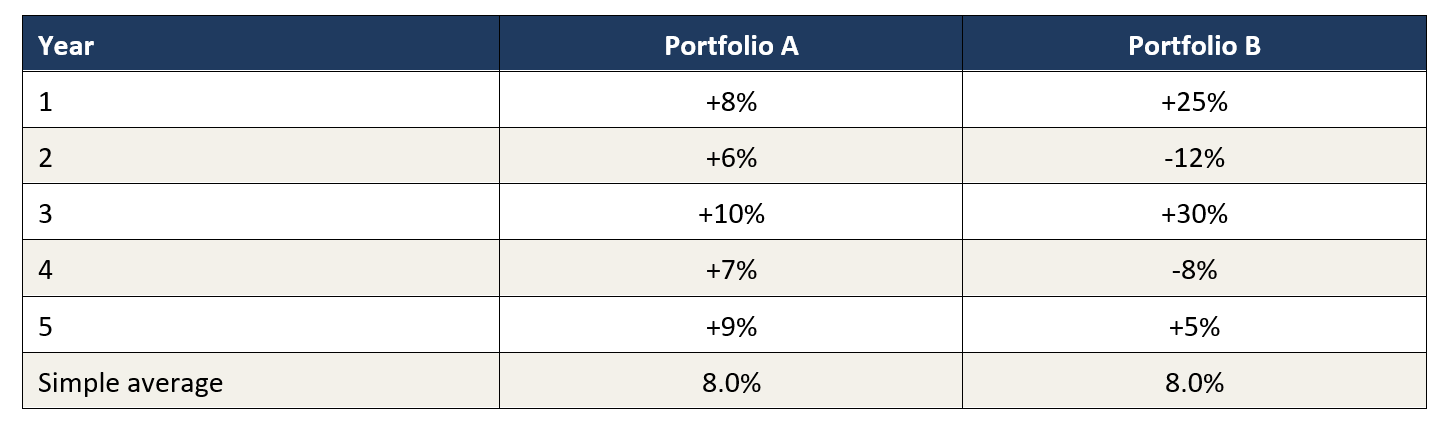
Both portfolios averaged exactly 8% per year on average, so they of course should end up in the same spot at the end of the period. Portfolio A ends the five years at roughly $146,900. Portfolio B ends at roughly $138,100. Same average, about $8,800 less, and the only difference is how bumpy the road was.
Why the bumpy road costs you money
This isn’t creative math just to prove a point. Portfolio B is not a remarkably unique stretch either to exaggerate volatility and add in years of negative returns. If we looked back at every five-calendar-year period of the S&P 500 over the last 100 years, about one in five contained exactly two down years, and one in three contained two or more. An investor can reasonably expect to live through at least one of these cycles during their working and retired lives.
When a portfolio loses 12%, it needs to gain more than 12% just to get back to where it started. Lose 12 percent on $100,000 and you have $88,000. Gain 12% on $88,000 and you have $98,560, not $100,000. Every loss makes the next gain work harder, and the bigger the swings, the bigger that penalty grows.
Investors sometimes call this volatility drag. The plain-English version is that big swings quietly eat part of your return even when the simple average tells a different story. In our example, Portfolio B's simple average is really 8%, just like Portfolio A, but the actual compounded growth rate works out to about 6.7% per year, not 8%. Portfolio A's works out to essentially 8%, because it barely had any swings to drag on it.
It gets worse when you are taking money out
Now make one slight change and suppose the person who owns each portfolio is retired and withdraws $6,000 at the end of every year to live on. This represents a withdrawal rate of roughly 6% throughout the period, which is within reason.
With those withdrawals, Portfolio A ends the five years at about $111,500. Portfolio B ends at about $105,900.
Now let’s assume Portfolio B's exact same five returns, but reorder them so the two losing years come first: -12%, -8%, then +5%, +25%, +30%. The average is still 8%. The compounded growth without withdrawals is still identical, about $138,100.
With the $6,000 annual withdrawals, however, that reordered portfolio ends at about $94,900. Roughly $16,600 less than the steady portfolio, and the only thing that changed was the order of the years. We call this sequence of returns risk. The risk fuels nearly every decision that we make around portfolio construction.
A retiree that is in the distribution phase of their portfolio and a 30-year-old saver cannot be handed the same portfolio and told to treat market fluctuations similarly. When a portfolio enters the distribution phase (retirement), a bad year is no longer an opportunity to consider buying shares at a lower price. Instead, a bad year can permanently shrink the base that every future good year builds on. For a portfolio that is still accumulating, negative years can be key years of adding to positions at a lower price or buying companies at a discount to their fair market value. This only works, however, if you have a plan in place to do just that, and you execute it.
What the industry does about this
The financial world has spent decades building tools to measure the ride and not just the destination. They go by names like standard deviation, Sharpe ratio, Sortino ratio, maximum drawdown, and beta. Each one answers a slightly different question:
How big are the swings? (standard deviation)
How much return did I get for the swings I put up with? (Sharpe ratio)
What if I only count the swings that went against me? (Sortino ratio)
What was the worst stretch, peak to bottom, and how long did it take to recover? (maximum drawdown and recovery time)
How much of my ride was just the overall market's ride? (beta)
In this series, we’ll look at what these fancy words and calculations look like in real life. We’ll do our best to give common sense examples of what the metric is trying to tell us, the actual formula, what it is good at, and what it misses. No single metric is "the answer." They are all parts to a system that, when maintained properly, helps us, help you get to where you’re going as efficiently as possible.
What this means for you
The point of measuring risk is not to avoid it. Risk is what you are paid to take. The point is to take the kind and the amount of risk that fits your situation.
For someone drawing income from a portfolio, we care a great deal about the size and timing of the down years, because those are the years that do lasting damage. Protecting against market loss is far more important in this stage than trying to keep up with every bull market. For someone who is decades from needing the money and adding to it regularly, a bumpy ride is far more tolerable, and the bigger risk is being too cautious for too long. This doesn’t mean we throw caution to the wind for the next 20 years, it means that we take advantage of volatility in the accumulation phase and set rules in place for when it is time to de-risk.
Which ride is right for you depends on where you are going, how soon you need to get there, and who is in the car with you.
Any opinions are those of Kirk McCarty and not necessarily those of Raymond James. Expressions of opinion are as of this date and are subject to change without notice. Raymond James and its advisors do not offer tax or legal advice. You should discuss any tax or legal matters with the appropriate professional. Investing involves risk and you may incur a profit or loss regardless of strategy selected, including diversification and asset allocation. Prior to making an investment decision, please consult with your financial advisor about your individual situation. Investing in oil or the energy sector involves special risks, including the potential adverse effects of state and federal regulation and may not be suitable for all investors.