
You have two job offers.
The first pays a steady salary of $80,000 a year. The second is a commission job that also averages $80,000 a year, but some years it pays $130,000 and some years it pays $30,000. Same average pay. Which one do you take?
Most people answer the same way: it depends. If you have a mortgage, two kids, and no savings, the steady job is worth more to you even though the average is identical, because the bad years in the commission job could sink you. If you are 24, single, and living with roommates, the commission job might be fine, and you might even enjoy the upside.
Now sharpen the question. What if the commission job averaged $95,000 instead of $80,000? Now you are being paid something extra for putting up with the swings. Is $15,000 a year enough? That is exactly the question the Sharpe ratio was built to answer.
The common-sense version
The Sharpe ratio measures how much extra return you earned for each unit of risk you took. Higher is better. It answers the question "was the bumpiness worth it?"
It was introduced by William F. Sharpe in 1966 and refined by him in 1994, and it remains the most widely quoted risk-adjusted return figure in the industry. Nearly every fund report you will ever see includes it.
How it is calculated
The formula has three ingredients.
The first is the portfolio's return over the period you are measuring.
The second is the risk-free rate, which is the return you could have earned with essentially no risk, usually represented by a short-term U.S. Treasury bill. The logic is that you should only get credit for return above what you could have earned by doing nothing risky at all. A positive difference your investment return minus the risk-free rate is called excess return.
The third is the portfolio's standard deviation (this should sound familiar) over the same period.
Sharpe ratio equals (portfolio return minus risk-free rate) divided by standard deviation. In algebraic form, it looks like this :
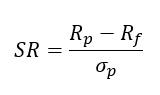
Where the formula shows:
Expected return of the portfolio (or asset)
Risk-free rate of return
Excess return (or risk premium) of the portfolio over the risk-free benchmark
Standard deviation of the portfolio's excess return (measuring total volatility)
Lets run through an example. For this example, we’ll assume the risk-free rate is 3 percent.
Portfolio X returned 9 percent per year with a standard deviation of 15. Its excess return is 6 points. Divide by 15 and the Sharpe ratio is 0.40.
Portfolio Y returned 7 percent per year with a standard deviation of 8. Its excess return is 4 points. Divide by 8 and the Sharpe ratio is 0.50.
Even though portfolio X made more money, portfolio Y made more money per unit of risk, remember a higher Sharpe Ratio is better. If you could have taken Portfolio Y and simply dialed up the risk to match X, the math says you would have ended up with more than X delivered. That is the insight the ratio gives you: it lets you compare portfolios with different risk levels on a level playing field.
These numbers are hypothetical, and the risk-free rate changes constantly, so a real Sharpe ratio for the same portfolio would differ depending on when it was measured.
Reading the number
There is no official scale, but as a rough guide, a Sharpe ratio below zero means the portfolio did worse than a Treasury bill, which is not what we are shooting for. Something in the range of 0.3 to 0.7 is typical for diversified portfolios measured over long periods. A ratio above 1.0 sustained over many years is uncommon and worth a closer look, because it usually means either a very good period for that strategy, a short measurement window, or something in the data that deserves scrutiny.
That last point matters. The Sharpe ratio is only as honest as the period it covers. A fund that has existed for three good years can show a spectacular Sharpe ratio that says nothing about how it will behave in a bad one.
What it misses
Three things.
First, it inherits the blind spot of standard deviation. Upside surprises count against you just as much as downside surprises. A portfolio that occasionally has a spectacular year gets penalized for it. The next post introduces the fix.
Second, it assumes returns are roughly bell-shaped. Strategies that make small steady gains most of the time and then have a rare large loss can show a beautiful Sharpe ratio right up until the loss arrives. Some of the most famous blowups in financial history had excellent Sharpe ratios the year before.
Third, it says nothing about whether the return was enough. A Sharpe ratio of 0.8 on a portfolio that returned 4 percent is mathematically impressive and practically useless to someone who needs 7 percent to fund their retirement plan.
What this means for you
The Sharpe ratio is the first thing we look at when comparing two ways of building a portfolio, because it strips out the effect of simply taking more risk. If one approach has a meaningfully higher Sharpe ratio than another over a long enough period, it is doing something more efficient, and that is worth understanding.
But a higher Sharpe ratio is not automatically the right portfolio for you. Go back to the job example, someone who needs $95,000 a year to make their plan work cannot take the steady $80,000 job no matter how much better it looks on a risk-adjusted basis. They need the return, and their job is to take the risk that comes with it as intelligently as possible.
That is the difference between an efficient portfolio and a suitable one. The Sharpe ratio helps find efficiency, but your plan determines your suitability. In our practice, the ratio is a tool for choosing among the options that already meet a client's need, not a substitute for knowing what the need is.
Any opinions are those of Kirk McCarty and not necessarily those of Raymond James. Expressions of opinion are as of this date and are subject to change without notice. Raymond James and its advisors do not offer tax or legal advice. You should discuss any tax or legal matters with the appropriate professional. Investing involves risk and you may incur a profit or loss regardless of strategy selected, including diversification and asset allocation. Prior to making an investment decision, please consult with your financial advisor about your individual situation. Investing in oil or the energy sector involves special risks, including the potential adverse effects of state and federal regulation and may not be suitable for all investors.