On September 16, the Federal Reserve raised its benchmark rate by a quarter of a percent (0.25%). Although the rate hike itself is not likely to have a tangible impact on inflation or asset prices, it’s interesting and telling of what may lay ahead.
The vote to raise rates was unanimous. That matters, because President Trump had been pushing hard for a rate cut, even threatening trade restrictions over it. Fed Chair Kevin Warsh went the other direction anyway, which is the first real sign he's willing to break from the White House on policy.
The driving decision to hike rates is inflation, plain and simple. Prices rose 3.4% year over year in August, well above the Fed's 2% target, and national wage growth hasn’t been able to keep pace. Warsh didn't mince words about it: “Inflation is the problem. Stable prices have been the problem for, now, more than five and a half years.”
A lot of the inflationary pressure is coming from oil. The conflict between the US and Iran pushed gas prices higher, with diesel hitting a record $6.31/gallon. Economists agree that raising rates does very little to fix this. The oil problem is a supply issue, less oil is flowing around the world right now, and interest rates hikes won’t change that. But enough rate hikes could dappen demand. With the unemployment rate at 4.1%, the Fed feels that there is room to tackle the inflation issue without tanking growth.
Fed officials are projecting more rate hikes before the end of the year, but Warsh has been intentionally vague about forward guidance. He wants to keep his options open.
The Impact
The Fed funds rate is the rate banks charge each other overnight, but it ripples out into almost everything you borrow or save money on.
If you carry a balance on a credit card, have a Home Equity Line of Credit, or have an adjustable rate loan, expect your rate to creep higher. Those are tied closely to the Fed funds rate. A 30 year fixed mortgage doesn't move in lockstep with the Fed (it tracks more with the 10 year Treasury), but the general direction of rates has been higher, and anyone about to finance a car or a home renovation is going to pay more to borrow than they would have a year ago.
The flip side is good news if you're a saver. High yield savings accounts, money market funds, and CDs tend to move up right along with the Fed funds rate. If you've had cash sitting in a checking account earning next to nothing, this is a good moment to start shopping for higher rate.
Rate hikes haven’t historically been great for stocks and bonds. Bonds feel it first and most directly. When rates rise, newly issued bonds pay more, which means existing bonds with lower coupons become less attractive and drop in price. The longer the maturity, the bigger the price swing. A 0.25% move won’t have much impact, but if the Fed’s embark on a longer term rate-hiking cycle (like 2022) bonds will struggle.
Stocks are more nuanced. Higher rates tend to hurt “growth stocks” the most, especially the ones trading at high valuations on the promise of earnings in the future. When you raise rates, the math gets less favorable for stock valuations.
There's also a currency effect. Higher US rates tend to strengthen the dollar relative to other currencies, and a stronger dollar is generally a headwind for large multinational companies with a lot of overseas revenue.
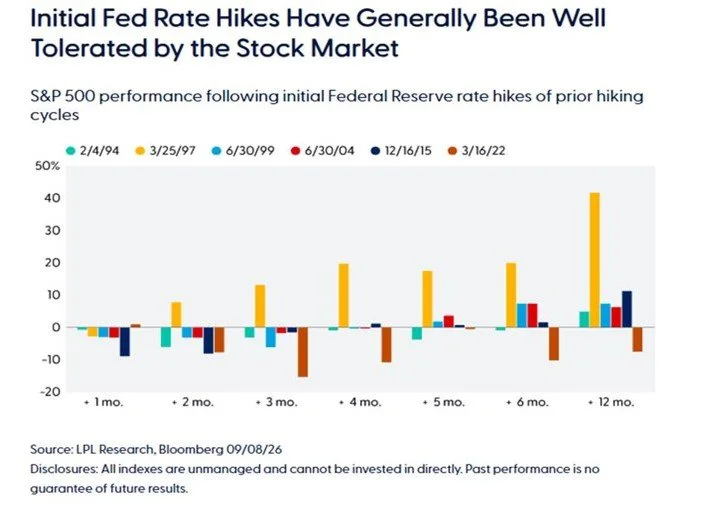
LPL Research looked at six tightening cycles going back to 1994 and found that stocks typically struggle in the first three to four months after the initial hike, then tend to recover. The average 12-month return following an initial hike was 6.7%, with a median closer to 10.7%. But averages hide a lot. In 1997, the S&P 500 gained about 8% within two months of the first hike and 42% over the following year as the dot-com boom took off. In 2022, it was the opposite story: stocks fell and stayed depressed for more than a year as the Fed hiked aggressively into surging inflation.
Separately, Ned Davis Research looked at 18 post-WWII tightening cycles and found the market had already climbed roughly 18% in the year leading up to the first hike, meaning a lot of good news tends to be priced in ahead of time. After the hike, the average maximum drawdown within six months was about 12%, and about 14% within 12 months. Interestingly, the speed of the hiking cycle matters quite a bit. When the Fed raises rates at almost every meeting, the average 12 month drawdown has been closer to 16%. When the Fed spaces hikes out and waits at least a meeting in between, drawdowns have averaged closer to 12%, with stronger underlying economic growth along the way.
So the pattern isn't always “stocks fall” or “stocks rise.” We expect some choppiness in the months ahead, but the outcome from there depends on how quickly the Fed moves and how strong the economy remains.
The Sobering Part
Looking back at 11 rate hiking cycles since 1965, 7 were followed by a recession. The others ended with “soft landings”, meaning the Fed raised rates without tipping the economy into a downturn, such as in 1983 to 1984 and 1993 to 1995.
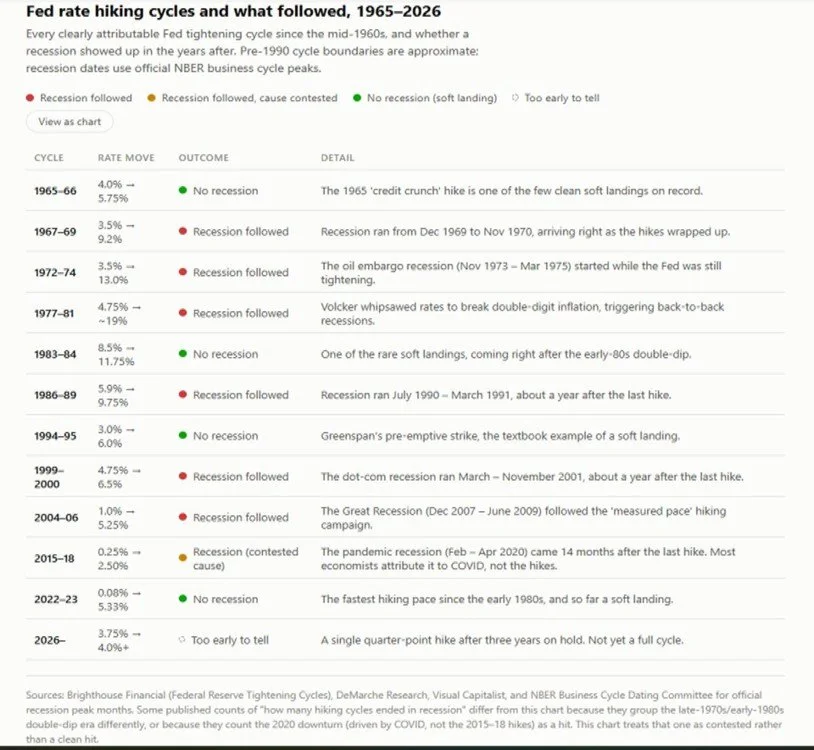
What happened this week was a 0.25% hike after more than three years on hold, not necessarily the start of an aggressive multi-hike campaign like 2022. The Fed itself is only projecting one or two more hikes this year. That's a very different setup than the fast, sustained tightening cycles that have historically preceded recessions. Still, rate hikes have historically increased the odds of a recession, especially with inflation coming from supply shocks the Fed can't directly control.
Where this leaves us
The Fed telling us inflation still isn't fully under control, and they're willing to accept some short term market discomfort to get ahead of it. History says the next several months could be choppier than the last few years have been, particularly for longer duration bonds and richly valued growth stocks. It also says that the outcome twelve months from now is genuinely uncertain and depends on whether this turns into a real hiking cycle.
We don’t anticipate making big portfolio changes based on one Fed meeting. This is exactly the kind of moment where a diversified mix across stocks, bonds, and cash does its job, cushioning the parts that get hit while you wait to see whether this is a pause or the start of something longer.
The range of outcomes for the investment landscape is large. This isn’t the time to chase returns and add considerable risk.
Any opinions are those of Brady Raanes and not necessarily those of Raymond James. Expressions of opinion are as of this date and are subject to change without notice. Raymond James and its advisors do not offer tax or legal advice. You should discuss any tax or legal
matters with the appropriate professional. Investing involves risk and you may incur a profit or loss regardless of strategy selected, including diversification and asset allocation. Prior to making an investment decision, please consult with your financial advisor about your individual situation. Investing in oil or the energy sector involves special risks, including the potential adverse effects of state and federal regulation and may not be suitable for all investors.
S&P 500: This index is a broad-based measurement of changes in stock market conditions based on the average performance of 500 widely held common stocks. It consists of 400 industrial, 40 utility, 20 transportation, and 40 financial companies listed on U.S. market exchanges. This is a capitalization-weighted calculated on a total return basis with dividends reinvested. The S&P represents about 75% of the NYSE market capitalization.